Mastering Camp Facility Management
(I introduce Four Quadrant Matrix here, it’s a supper quick read)
The first lesson of budgeting expenses, and one that should be taught in grade school, is that you can spend money on whatever you want - But you can only spend each dollar once.
Seems simple but as Camp directors it’s one of the hardest lessons that we have to learn and teach others. Our staff have great ideas that they are sure will make money. They know if they just had this one thing everything would be better. Sometimes we relent and that item then sits unused for weeks in a box in the office.
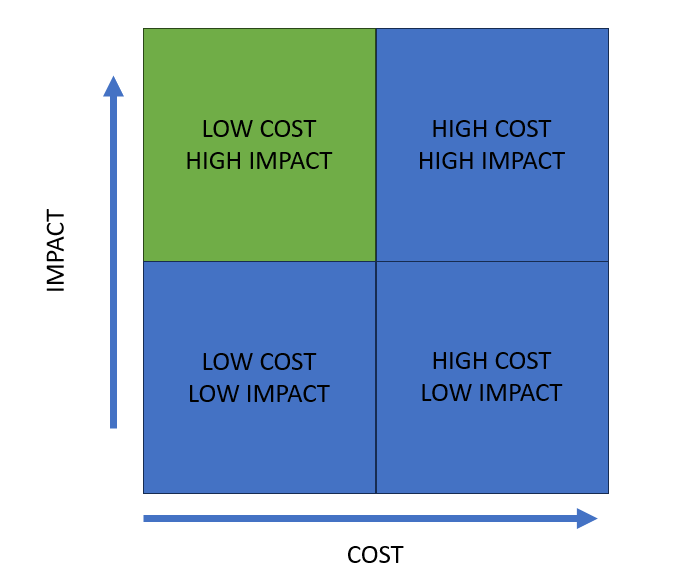
The larger the item and the bigger the perceived need, the harder the choice. If the waterfront, our barn, our pool, and our ropes course, our staff, all need investment, but resources are limited. How do we best spend the money? I use a series of simply four quadrant matrix to visualize the return on a decsion.
On the X axis (horizontal) we have the cost of the item (this axis is always cost). On the Y axis (vertical) we place one of a handful of values potential values. 1st year ROI, 10-year Plus ROI, Program Impact, Parent experience, and health/safety wellbeing. (Staff experience, Environmental impact, Licensing/Accreditations/permitting are examples of ones I uses but infrequently)
On a recent Walkthrough we were discussing Curb appeal (A favorite of my boss.) so we were viewing work through a Cost/Impact lense.
COST/IMPACT
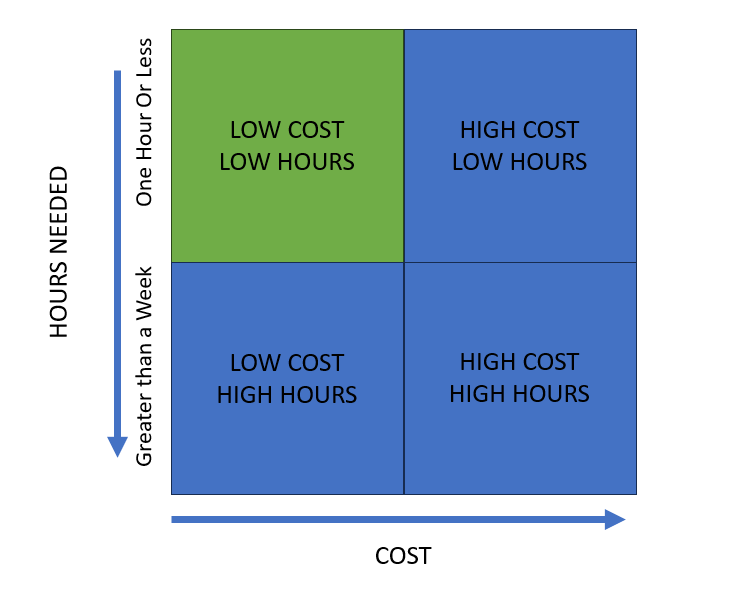
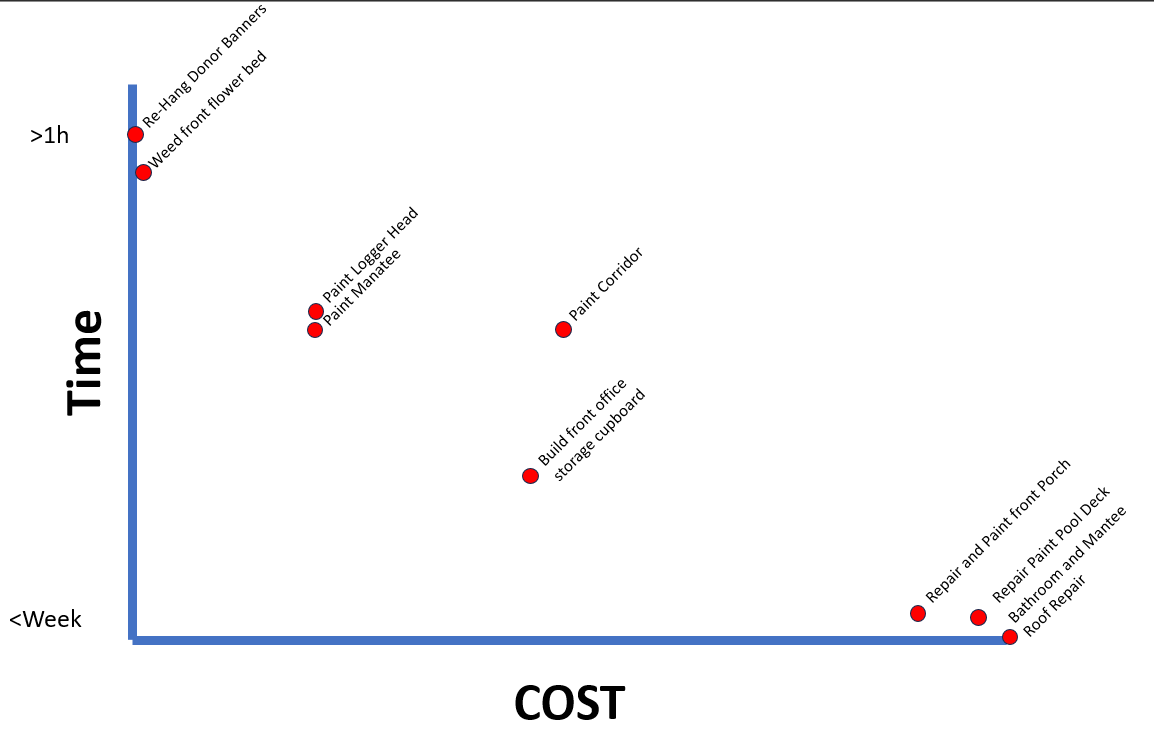
We then put the same items into a second matrix. Cost/Time to Complete
Note the Hours axes is reversed to keep the optimal outcome in the top left.
Items that fall in the Top Left quadrant should be our focus. Items that fall in the bottom left should be avoided where possible.
When we change the data on the Y (vertical axis) the items start to move around. Allowing us to view the same work from a slightly different perspective, Only now do we get a better idea of where to use our resources. For example, a upgrade to your sewage system, something that could be hundreds of thousands of dollars but goes largely unseen, costs a lot but has little visible impact, little impact on parent experience and minimal impact on a single year ROI. But on your staff experience – No backed up toilets, Your camper experience – No more weird smells, and your 10 year plus ROI – Increased capacity. It starts to move from the bottom right to the top right and you start to see its value.
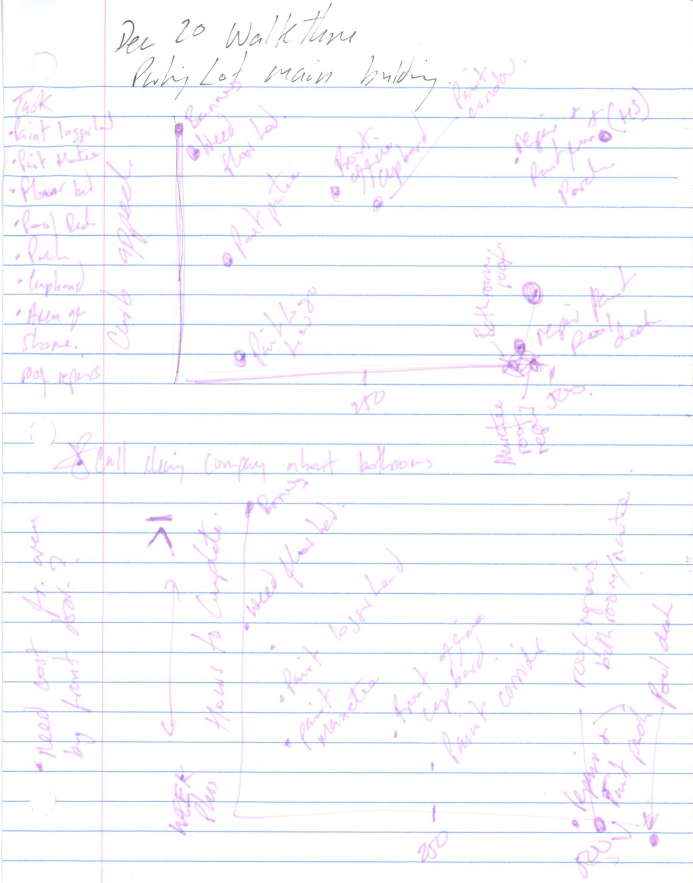
My excel skills are weak so I have always had to do this by hand. But I can do it quickly often while walking through camp. We do a quick Fermi Estimation for costs and benifits. To calculate the 1 year and the 10 year ROI by subtracting the cost from the estimated margin over 1 or 10 years. Fermi estimations are used again for margin. For experience and impact, I use a 0 to 10 scale of no impact to 10 high impact.
Here is the actual sheet from a quick walk through of our entrance area. (Please excuse my terrible hand writing, i wasn’t writing on a hard surface, but you can even see where my pen ran out, and i had to change color. Its all very authentic.)
You’ll notice some marginalia. There is a note for the cost of a project by the front door. We have no idea what to do, or how much it costs but we know its important. There is a list of projects on the top left. There is a second note about needing to call the cleaning company about the bathrooms who have not been doing a great job. There is also a mess in the bottom left of both grids as we debated the cost, and I thought about the impact of the two repairs to the water damaged roofs.
these are quick working documents that are writen up and debated in meetings. But we all understand the criteria and is visually easy to follow.
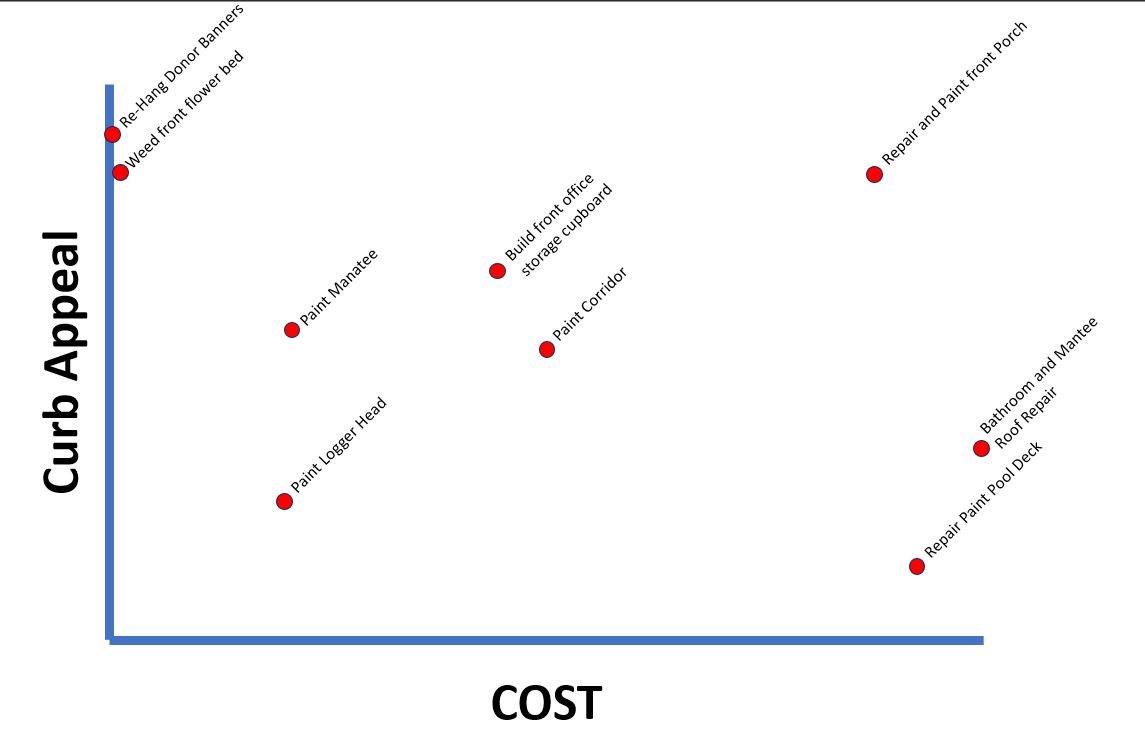
Here is the same sheet converted to a slide. Its now easy to read and easy to share.
What’s clear is that there are few projects that stood out. The donor banner that had fallen and the flower bed weeding. Both are low-cost high appeal items, the banners also have a long time ROI as they recognise Major gifts, but that is not captured here. The flower bed was going to take longer, but equally impact full. The one item was completed that afternoon (banners); the other was started the following morning. The paint projects had different perceived impacts (based on location), were going to take similar amounts of time, but had different costs. With this information we were able to prioritize the projects. Mantee, logger head, corridor.
This was a quick walk through. Less than 15 minutes, but we able to prioritize a to do list we all agreed on.
We do this for full facility walk throughs with, with equipment purchases, with ideas for capital projects and fund rasing Some grids have hundreds of items.
As items get broken. or out needs change the items move around, but they are easy to track.
Post Image is AI using DALL-E. The images are getting better fast.
